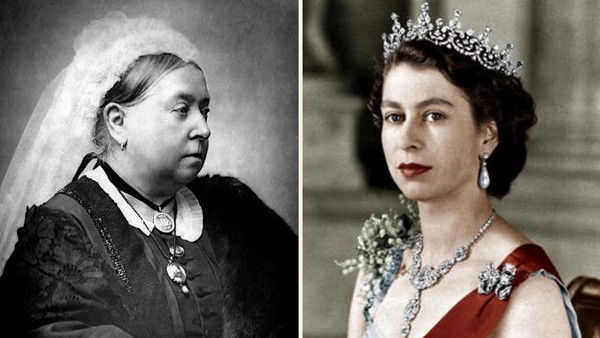
 Elizabeth II will overtake Victoria as Britain’s longest-reigning monarch on Wednesday evening. But apart from the two monarchs’ longevity, how do their reigns compare?
The FT’s statistics and graphics teams take a look below at the similarities and differences between the Victorian era and the “New Elizabethan” age, as well as how Elizabeth’s nation and subjects have fared in the 63 years since she was crowned.
THE CHANGING SHAPE OF THE NATION
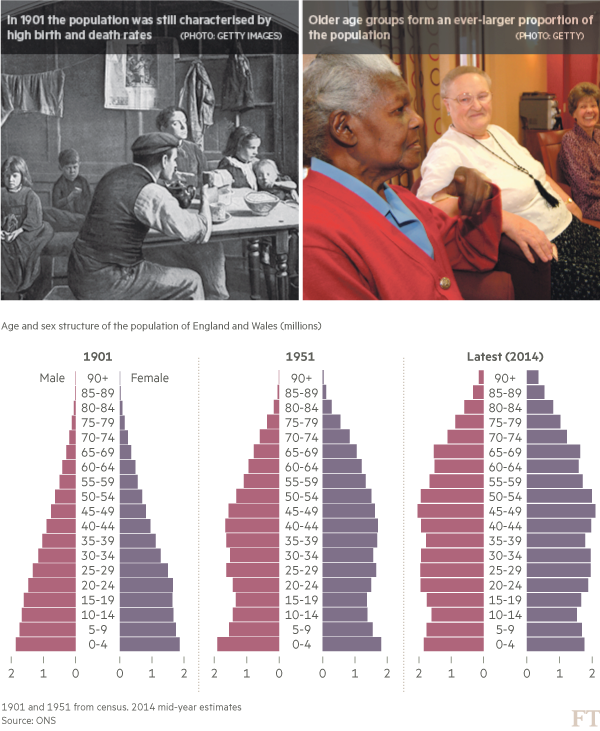
The population pyramid from the 1901 census — the year of Victoria’s death — shows the shape seen in less developed countries today, with both birth and death rates high by modern standards, and would have differed from the first census of her reign, in 1841, only in the overall size of the population.
In the 1951 census, just before Elizabeth’s reign began, the impact of two world wars can be clearly seen in the dip between the young and the middle aged, but perhaps the most notable difference is the proportion of older people.
This process has continued, with the retired forming an ever-larger share of the population. The number of centenarians at the time of the 1901 census was a mere 146; while latest figures suggest the Queen sent out almost 14,000 letters of congratulation to centenarians in 2013.
HIGHER GROWTH IN THE ‘NEW ELIZABETHAN’ ERA

Even though Victoria ruled over the British empire at its height, growth in gross domestic product averaged 2 per cent annually in the Victorian era, compared with 2.5 per cent a year in the Elizabethan era.
The pattern of growth is also noticeably different. The 19th century experienced shorter periods of expansion and contraction — the “trade cycle” of classical economics. By contrast, the past six decades have seen long periods of expansion, especially from the 1950s up to 1973, and the 1990s up to 2008, but also four major recessions, with that of 2008-9 the worst since the 1930s.
TWO CHANGES IN WORK — AGRICULTURE TO INDUSTRY; MANUFACTURING TO SERVICES

The industrial revolution in the 18th century had begun the process of migration from the countryside into the cities. This accelerated during Victoria’s reign — the population of London trebled from 2.2m to 6.6m, while that of Glasgow rose from 280,000 to 900,000. The census of 1851 was a historic moment: for the first time a nation, excluding city-states, had a predominantly urban population.
The past 60 years have seen a different kind of change. People still live in cities but increasingly work in service-based jobs. Some areas founded on heavy industry have experienced decline but others, particularly London and the South-East, have thrived.
Agriculture in the UK has continued its relative decline and now forms the lowest share of output of any major developed country — less than 1 per cent of gross domestic product.
TWO TRANSPORT BOOMS

Both periods were times of rapid transport expansion. The Victorian era is practically synonymous with the railway age, but perhaps the present Queen’s reign can be characterised as the “automobile age”. What is most interesting from the graphical point of view is that the growth of the rail network under Victoria developed at a strikingly similar rate to the rise in car ownership under Elizabeth II
A DEVALUED SOVEREIGN

One area in which the Victorians definitely had the edge over the Elizabethans was in the value of the pound. Price rose in the 19th century, of course, but there were also times when they fell back — and prices were often dependent on how good the harvest was in any given year.
A new, and global, phenomenon was the persistent rise in prices seen from the 1970s until the 1990s. Average prices are now some 1,820 per cent higher than in 1952, equating to 4.8% inflation per year since then.
A REIGN OF TWO HALVES

If we take the New Elizabethan age alone, we can see that the changes in Britain’s economy and society have been every bit as far-reaching as the changes between the 19th century and the second half of the 20th century. In many ways, 1952 has more in common with 1901 than with 2015.
When it comes to the domestic economy, and the relevant government policy, we can divide Elizabeth’s reign into two periods, hinging on the mid to late-1970s.
In the first part the “postwar consensus” still held sway. Governments, Conservative as well as Labour, supported taxation to fund the welfare state. Large parts of industry were state-owned. This broke down in the 1970s as inflation rose — peaking at 27 per cent in mid-1975 — and the first serious recession since the war saw the return of mass unemployment.
The Labour government of 1974-79 tried to limit public spending even before Margaret Thatcher’s election victory in 1979. Post-Thatcher, a new consensus emerged, of low taxation and spending, and market-centred solutions to economic problems.
The later period has been characterised by rising inequality, which had been falling on many measures up until the late 1970s. More of the gains from growth since then have accrued to the top income brackets.
ONCE THIRD, NOW STRUGGLING TO REMAIN IN THE TOP 10

In 1952 the UK was still the third-biggest economy in the world, only behind the superpowers of the US and the Soviet Union, and became the world’s third nuclear power late in that year.
Now, on some measures the UK barely holds a position in the top 10 largest economies, overtaken by former wartime enemies and emerging economies.
TRADE PATTERNS HAVE SHIFTED FROM EMPIRE TO EUROPE

Dean Acheson, the former US secretary of state, said in 1962 that Great Britain had “lost an empire but failed to find a role”. The problem is starkly illustrated by the UK’s shifting patterns of trade. In the early 1950s trade was still concentrated on the remnants of empire. Now it is dominated by the countries of the EU. Relations with its European neighbours have been, and still are, a major factor in the UK’s adjustment to a changing global economy.
FAMILY AFFAIRS . . .

Social norms have undergone huge transformation under Elizabeth. Family structures are no longer as rigid as they were, partly reflecting the waning influence of religion. Women are having fewer children and having them later, and the average size of households has fallen. Divorce and single-parent families — socially stigmatised in 1952 — have become far more commonplace.
. . . AND HOME AFFAIRS

Continuing this theme, many other aspects of the UK economy and society since the 1950s show a decline in collective provision and identification, replaced by an individualism defined by ownership. As we saw above, transport is now dominated by privately owned cars. Nothing illustrates this better than housing, however, with consumer confidence and, consequently, economic growth tied to fluctuations in house prices.
A TWO-PARTY SYSTEM NO LONGER

In politics, too, the old tribal identities have broken down. The Conservative and Labour parties — with largely class-based allegiances — claimed 98 per cent of the popular vote in the 1951 general election. The outgoing Labour government won 49 per cent of the vote — and lost. No party has claimed even 40 per cent in the last two elections, and a third of the electorate no longer supports either of the “big two” parties.
THE FALL AND RISE OF ENGLISH LEAGUE FOOTBALL

There have been so many changes in how we spend our leisure time it would be impossible to list them all. Among the most interesting patterns, however, is how the national sport of football has fared since 1952.
Apart from a blip following England’s World Cup win in 1966, attendances at English league matches had been on a declining trend, reaching a nadir in the mid-1980s. After 1992, with the advent of the Premier League and improvements to grounds after several disasters throughout the 1980s, attendances began to rise again and now total 30m spectators per season — comparable with levels in the 1950s
This does not include the millions who now watch live games on the screen. In the 1950s only the FA Cup final and a few England internationals were televised. The sums of money involved are now incomparable. The annual fee to televise Premier League games for 2016-19 would have been 11 per cent of GDP in 1952, after adjusting for inflation.
In terms of defining moments, however, the triumph on 1966 may have had much less impact than the drubbing England received at the hands of the Hungarians in 1953, the year of Elizabeth’s coronation. They lost 6-3. Seeking to avenge the defeat in Budapest the following year, they lost again — 7-1.
http://www.ft.com/intl/cms/s/0/0f25f9b8-5640-11e5-a28b-50226830d644.html#axzz3lHDUJyV9